"Confusion and clutter are failures of [drawing] design, not attributes of information. And so the point is to find design strategies that reveal detail and complexity -
rather than to fault the data for an excess of complication. Or, worse, to fault viewers for a lack of understanding."
—Edward R. Tufte[1]
 Entity/relationship models (or simply "data models") are powerful tools for analyzing and representing the structure of an organization. Properly used, they can reveal subtle relationships between elements of a business. They can also form the basis for robust and reliable data base design.
Data models have gotten a bad reputation in recent years, however, as many people have found them to be more trouble to produce and less beneficial than promised. Discouraged, people have gone on to other approaches to developing systems -
often abandoning modeling altogether, in favor of simply starting with system design.
Requirements analysis remains important, however, if systems are ultimately to do something useful for the company. And modeling -
especially data modeling -
is an essential component of requirements analysis.
It is important, therefore, to try to understand why data models have been getting such a "bad rap". Your author believes, along with Tufte, that the fault lies in the way most people design the models, not in the underlying complexity of what is being represented.
An entity/relationship model has two primary objectives:
-
First it represents the analyst’s public understanding of an enterprise, so that the ultimate consumer of a prospective computer system can be sure that the analyst got it right. Does the analyst really know the business? A properly drawn data model can provide a vivid answer to that question quite vividly. To the user it addresses the question: "Is this what you want?"
-
Second, it represents the fundamental architecture of an enterprise’s data, and as such is an ideal starting place for database design. To be sure, the final structure of a database may differ from the data model for good and valid reasons, but the closer it remains to the original structure, the more likely it is to be able to resist requirements for future changes. To the system designer and builder, it sends the message: "This (rigorously described) is what you are to build."
Because data modeling was created within the computer industry, the second objective has often taken priority. As drawn by systems engineers, data models tend to look like electronic schematics -
to be read only by other engineers. The morass of boxes and lines makes them quite formidable to all but the most dedicated reader. Many data modeling conventions -
and a great many data modeling practitioners -
do not put enough weight on the importance of making the model accessible to the outside world.
Indeed, some contend that the models cannot be made accessible to the outside world, so there is no point in even trying.
This article takes the position that not only is it possible to produce model drawings that can be understood by potential systems users, but it is our responsibility to do so. Here follow some guidelines as to how to do this.
There are two major issues in the readability of models. The first, and the one to be discussed most here, is aesthetic. How is the drawing constructed and to what visual effect? The second is the way things in it are named. Are the words on the diagram helpful in divining its meaning?
Aesthetics
Data modeling was originally an engineering discipline, not an artistic one. For this reason, most modelers pay less attention to aesthetics than they should. Part of the problem is the system of notation they use. Some notations lend themselves to improved aesthetics, while others produce drawings that are nearly impossible to read, regardless of what the modeler does. The rest of the problem is in the way the modeler does his work.
The aesthetic considerations to be discussed here are: 1) the ordering or arrangement of symbols on the model, 2) the number of symbols on the model, 3) the number of symbol types there are, and 4) how the various layers of the model interact with each other.
The modeler has control over the arrangement of the drawing, the number of symbols he uses, and the overall layering of the diagram. The system of notation chosen also affects layering, and determines the number of kinds of symbols that will be present.
Order
How the entities are placed on a page is critical to the viewer’s ability to understand a diagram. Typically (especially if the model was produced via an automated tool), there is no rationale to entities’ relative positions on a diagram. They wind up where ever it is convenient to put them. In some cases, people will rearrange entities to minimize the crossing of lines, but this adds no semantic meaning to the picture.
This has the effect that as you look at a model drawing, you have no way to get a hold of its overall meaning. You see a random collection of boxes and lines. There is nothing in its overall shape to tell you anything about it.
A very powerful convention for positioning entities is to force all relationships to point in the same direction. Your author follows the "dead crow" rule, that all crow’s feet should have their toes pointing either up or to the left. This has the effect of placing the reference entities -
the entities describing tangible things in the business - on the lower right, and the transaction entities - those describing what the enterprise does - on the upper left. Others reverse the convention, pointing crow’s foot toes south and east. Whichever convention is followed, however, anyone looking at a model following such a convention can now quickly see what it’s about (products, laboratory tests, etc.) and what things of interest there are about that.
Too many symbols
The simplest thing we can do to improve the appearance of a model is to limit the number of figures on any one drawing. Twenty seems to be about the maximum that is possible without making a drawing completely unreadable, and ten to fifteen is better.
By figure here is meant any two-dimensional graphic object. The number of relationship lines present is less significant, and this will necessarily be a function of the number of things to be connected. You can, however, reduce the number of line segments as well, by eliminating "elbows" in the line. A bent line after all is graphically two lines.
Too many symbol types
Clearly the more different kinds of figures that are on the page, the more confusing the result will be. The question is, how many do we need? Each different kind of symbol is something new for your viewer to learn, and therefore is one more obstacle to understanding. One of the reasons models often become cumbersome is that we try to do too much with them. There is a limit to the amount of information that can be conveyed on one page.
As a minimum, we need symbols for:
- Entities.
- The existence of relationships between pairs of entities.
- Optionality: Must an occurrence of one entity have a corresponding occurrence of another, or not?
- Cardinality: May an occurrence of one entity have more than one corresponding occurrence of another, or not?
In addition, it is often necessary to represent sub-types of an entity - sets of occurrences that represent subsets of the occurrences of the entity. There is a question, however, as to how elaborate this representation should be. There also is a question of whether to represent attributes of an entity, and how. And finally, many notations - but not all - represent the elements which uniquely identify an occurrence of an entity.
A wide variety of data modeling techniques are being used today. The original notation was invented by Peter Chen.[2] Among those most commonly used since Mr. Chen’s work are James Martin’s Information Engineering[3] and IDEF1X[4]. The latter is the standard for the Federal Government. Also popular is Oracle’s Oracle Method (formerly the CASE*Method)[5], and the Structured Systems Analysis and Design Method (SSADM)[6], which is particularly popular in Europe.
Lately, the object-oriented phenomenon has produced several techniques for drawing "object models" instead of entity/relationship models. While object models do include descriptions of the "behavior" each entity, they otherwise show exactly the same concepts as e/r models. Indeed, James Martin’s "object diagrams", for example, are literally his entity-relationship diagrams renamed[7] (although he does modify his sub-type notation somewhat). Among the most popular object modeling techniques are those published by James Rumbaugh and his associates[8], Sally Shlaer and Stephen Mellor[9], and the team of David Embley, Barry Kurtz, and Scott Woodfield[10]. Ed Yourdon has also published a book on object modeling[11].
A completely different approach to modeling data structure is presented in Object-role Modeling, formerly known as NIAM[12].
In this paper, examples from many of these techniques will be presented. The principles discussed, however, apply to all of them.
Entities
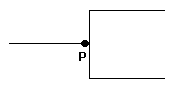
Representation of the first concept is not controversial. A box, with rounded or square corners (or in some cases, an ellipse) can represent an entity. This is a thing of significance to the organization, about which it wishes to hold information. Entities are the primary objects on an entity/relationship diagram. Figure 1 shows some entities.

Figure 1: Entities
Do be sure, however, that you are in fact modeling entities - things of significance to the business - and not just a database design. The concepts and issues which go into database design are by and large not of interest to the general public.
Relationships
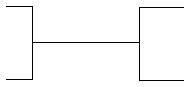
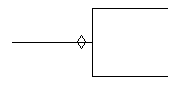
At its simplest, a relationship is represented in most techniques by a simple line connecting two entities. Optionality and cardinality are then shown as characteristics of the relationship by additional symbols, as discussed below. In those cases where a relationship itself has attributes and other relationships to it, many techniques endorse simply defining an entity to represent the relationship as itself being a thing of significance to the enterprise. A LINE ITEM, for example, is essentially a relationship between an order and a product, but most approaches treat it as an entity in its own right.
Mr. Chen, on the other hand, adds a different symbol (a rhombus) in the middle of the relationhsip line, to allow him to show these entity-like characteristics, without losing the fact that it is something other than an entity that is being represented.
Figure 2, for example, shows the three-way relationship PROJ-PART-SUPP[13], which is the fact that a PART is supplied to a PROJECT by a SUPPLIER. An alternative to this approach would be to replace PROJ-PART-SUPP with an entity of the same name. (Better yet, replace it with an entity that has a meaningful name, such as SUPPLY. See the discussion of names, below.) This would mean the same thing, while eliminating the second symbol type. Mr. Chen would probably argue that this second approach camouflages the object’s role as a relationship. The question we must answer is: how important is that to the viewer’s comprehension of the model, and does the distinction have any effect on database design?
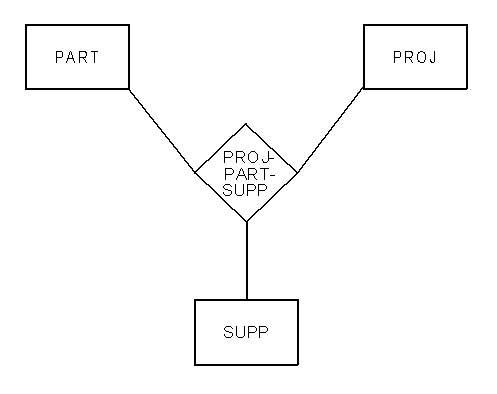
Figure 2: Chen’s Relationships
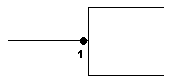
Optionality and Cardinality
The most direct way to approach optionality and cardinality is to simply place numbers by the target entity. The Chen, Coad/Yourdon, and several of the object-oriented techniques do this. "Must be at least one but may be any positive number" is shown by "1,m". "Must be exactly one" is shown by "1,1". "May be zero or any number" is shown by "0,m". And so forth.
This keeps the graphics simple and puts this information on a different graphic "layer" (see below) than the rest of the drawing. It means, for example, that the information must be processed by the left brain as data, rather than the right brain as a graphic experience. This makes the effect less powerful.
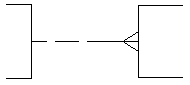
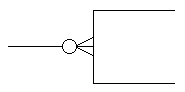
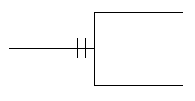
A small graphic symbol and its absence can also convey whether or not an occurrence of an entity may have more than one occurrence of a related entity. Another symbol or its absence can convey whether the upper limit of the relationship is one or more than one. As small symbols, these do not compete graphically with the overall presentation of entities and relationships. Typically, a crow’s foot or its absence shows cardinality. The Oracle Method uses this convention. James Martin’s Information Engineering uses the crow’s foot for an upper limit of "many", but instead of just leaving it off for an upper limit of one, it adds an extra mark across the line.
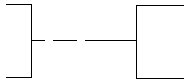
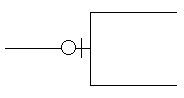
There is less agreement on the representation of optionality. James Martin puts a circle next to the optional entity and a mark across the relationship next to a mandatory entity. ("One and only one" then winds up with two marks next to the entity.) Oracle’s Oracle Method uses a dashed half-line for an optional relationship and a solid half line for a mandatory one. SSADM assumes that in most cases the many side is optional and the one side is mandatory, so it only adds a circle in the middle of the line for those cases where the one side is optional. It doesn’t permit the many side to be mandatory.
Table 1 shows Oracle Method’s treatment of optionality and cardinality, and Table 2 shows James Martin’s symbols. Mr. Martin’s symbols are a bit more busy, but note how, in both cases, if you know that the symbols for the upper limit, you know the cardinality regardless of the optionality. Similarly, if you know the symbols for lower limit, you know optionality regardless of cardinality.
Ms. Shlaer and Mr. Mellor use a different set of graphics (Table 3), but they also show consistency for all combinations of optionality and cardinality.
| |
|
Upper Limit = 1
(Single line) |
Upper Limit = M
(Crow’s foot) |
| |
Lower Limit = 0
(Dashed line) |
 |
 |
| |
Lower Limit = 1
(Solid line) |
 |
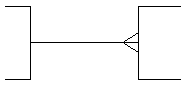 |
Table 1: Oracle Method Cardinality and Optionality
| |
|
Upper Limit = 1
(Single line) |
Upper Limit = M
(Crow’s foot) |
| |
Lower Limit = 0(Circle) |
 |
 |
| |
Lower Limit = 1
(Single line) |
 |
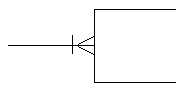 |
Table 2: James Martin Cardinality and Optionality
| |
|
Upper Limit = 1
(Single arrow) |
Upper Limit = M
(Double arrow) |
| |
Lower Limit = 0
(Added "C") |
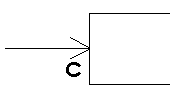 |
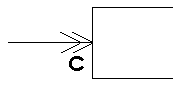 |
| |
Lower Limit = 1
(No added "C") |
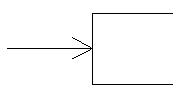 |
 |
Table 3: Shlaer and Mellor Cardinality and Optionality
By far the most complex system of notation is also one that is widely used - IDEF1X. It is the standard for the U.S. Government and is common elsewhere as well. Unfortunately, it suffers from several problems that make it more complex than is necessary for the purposes we are pursuing here. Specifically, it:
- Does not separate symbols for cardinality and optionality.
- Uses complex symbols for simple concepts.
- Uses multiple symbols for the same concept.
Table 4 shows that it is not possible simply to know the symbol for the lower limit in order to know what to put on the relationship. Similarly, there is no single symbol for the upper limit. The viewer must learn all four combinations separately, since there is no system relating them to each other.
As with the other notations, each symbol is made up of several elements. Here, however, the elements are not semantically significant. They are simply a random collection of signs which have no meaning by themselves. The dot in IDEF1X, for example, means either "zero or more" (if it is by itself), "zero or one" (if it has a "Z" next to it), "exactly one" (if it has a 1 next to it), or "1 or more" (if it has a "P" next to it). This makes it extremely difficult for the casual viewer to understand the notation.
Things are made even more complicated by the fact that in IDEF1X there is more than one symbol combination for the same concept. Table 4 shows the two ways to represent "must be exactly one" and "may be zero or one". It happens that there are subtle differences in the way these are implemented, but these are not important to the conceptual model.
| |
|
Upper Limit = 1 |
Upper Limit = M |
| |
Lower Limit = 0 |
|

|
| |
Lower Limit = 1 |
|
|
Table 4: IDEF1X Cardinality and Optionality
Attributes
There is also a question of whether attributes must be shown, and if so, how.
The tidiest model clearly is one in which attributes are not shown. If the model is being presented to a group for the purpose of communicating the basic nature of the entities and relationships, it is better to leave them off. In your presentation of the model, describe enough of them to make clear the meaning of each entity, but they don’t have to be on the drawing. Adding them as text inside the entity boxes does not have a serious impact on the overall readability of the model, however (as long as there aren’t too many), so if you want to include them, go ahead. Figure 3 shows this. Note that in this example, the attributes themselves have been flagged as to whether each is mandatory (*) or optional (.). These additional symbols add information without cluttering the overall model.
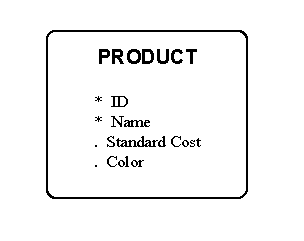
Figure 3: Attributes
Some techniques (Object-role Modeling and Chen) go a step further, however, by showing attributes in additional circles (or ellipses) on the drawing. Mr. Chen’s notation is shown in Figure 4. This greatly increases the number of symbols that must be on a page, thus making the model more complex.
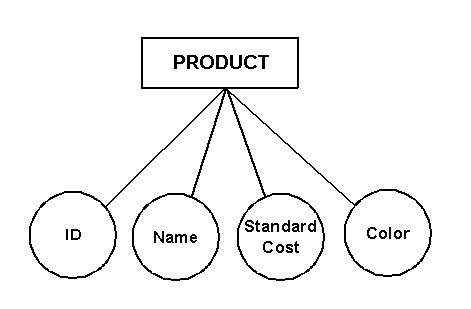
Figure 4: Chen Attributes
Object-role Modeling takes the unusual approach of not distinguishing graphically between attributes and entities. This is based on the premise that the relationship between an attribute and an entity is conceptually the same as a relationship between two entities. While this also makes the model more crowded than the notation shown previously, the consolidation of entities and attributes actually reduces the number of kinds of symbols by one. The "not too many objects" rule still applies, though, and this will require the domain of each drawing to be smaller. Figure 5 shows our example using Object-role Modeling, where the relationships between an entity and its attributes have now been made explicit. "ID" and "Name" are shown to be mandatory by the dots on their relationships, next to PRODUCT.
The arrows under has in each relationship simply mean that PRODUCT can have only one value for each attribute -
thus requiring the model to be in first normal form. This representation of uniqueness in ORM is difficult to master initially (it is another symbol, after all), but it does allow this technique to represent subtleties not available to conventional e/r modeling. It extends to the relationships between an entity and its attributes the same concepts of optionality and cardinality that we have been discussing between entities themselves. The notation is the same whether the ellipses stand for entities or attributes: for cardinality, he presence of a double-headed arrow under the left side of the relationship means that only one occurrence of the object on the right may be applied to an occurrence of the object on the left. Without it, a product could have more than one value for "ID". Similarly the dot or its absence represents optionality for both attributes and entities.
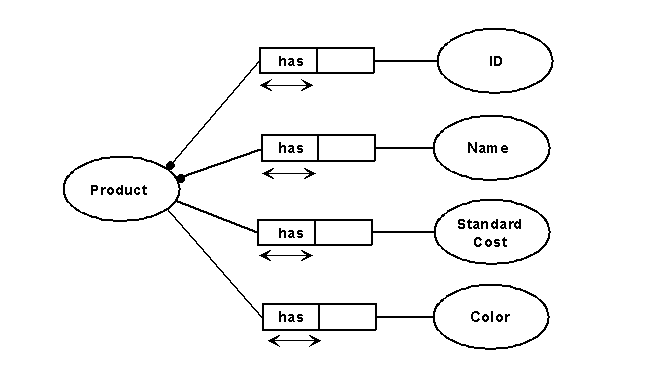
Figure 5: ORM Attributes
Sub-types and Super-types
A sub-type is an entity which represents a subset of occurrences of another entity -
its super-type. An occurrence of the super-type is also an occurrence of one and only one sub-type, and an occurrence of a sub-type must also be an occurrence of the super-type. Some techniques take the Venn diagram approach of showing the sub-types inside the super-type. Figure 6, for example, shows Mr. Martin’s Information Engineering notation for sub-types and super-types. This has the advantage of compactness and of emphasizing the fact that an occurrence of the sub-type is an occurrence of the super-type. The compactness allows the super-type and all its sub-types to count graphically as one object, making it easier to follow the "not too many objects" rule above.
This has the disadvantage, however, of making it impossible to show the case where a sub-type is of more than one super-type ("multiple inheritance" in object-oriented lingo). It is also not possible to show the case where a super-type has more than one set of non-overlapping sub-types ("Orthogonal sub-types").
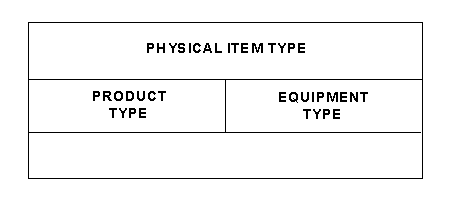
Figure 6: Compact Sub-types
To represent these situations, it is necessary to show the sub-types outside the super-type entity with a relationship (often called an "isa" relationship) tying them together. While this does provide the added expressiveness, it has the disadvantage of adding objects to the diagram, and of reducing the clarity of the sub-type concept. Figure 7 shows the example from Figure 6 in this external version, as specified by the Object Modeling Technique (described by James Rumbaugh and his colleagues). A similar approach is used by other object modeling techinques and IDEF1X.
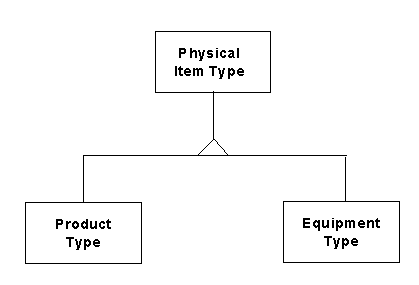
Figure 7: "ISA" Relationships
Your author contends, however, that multiple inheritance is a bad idea. In his experience, every example of multiple inheritance (and its complexity) could be eliminated by doing the model differently. Similarly, sub-types are reserved for the situation where the structure is fundamental, and in these cases it is highly unlikely that there would be more than one set of sub-types for a super-type. The other situations can be handled by defining a . . . CATEGORY entity, where each occurence of the entity may be (or must be) a member of one (or one or more?) . . . CATEGORY. For example, in Figure 8 shows that each PHYSICAL ITEM TYPE must be a member of one or more PHYSICAL ITEM TYPE CATEGORIES. Examples of PHYSICAL ITEM TYPE CATEGORY could be "product type" and "equipment type", along with all the other possible sub-types.
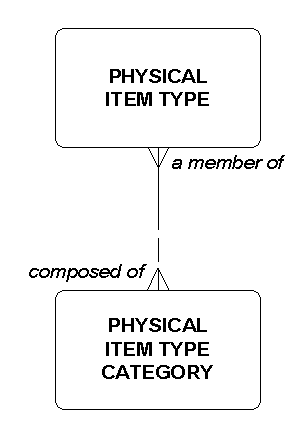
Figure 8: The Category Approach
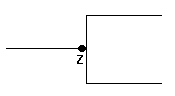
Unique Identifiers
An additional concept that can be represented on a model is the set of attributes and relationships which uniquely identify an occurrence of an entity. Many of the notations do not include this information. Some, such as Oracle’s Oracle Method, simply add a special symbol (such as the "#" in Oracle’s case) in front of an attribute participating in the unique identifier, and place a symbol (in Oracle’s case, an extra mark) across a relationship participating.
In Figure 9, COURSE’s unique identifier, for example, is simply the attribute "ID". COURSE OFFERING’s unique identifier is a combination of the attribute "Sequence" plus the relationship to COURSE. This means that when this model is implemented in tables, the primary key of COURSE ("ID") will become a foreign key in COURSE OFFERING. It and "Sequence" together will form the primary key of that table. Note that COURSE OFFERING is also related to TEACHER, but this is not part of the unique identifier, so it does not have the short line crossing the relationship. Each line is partially solid and partially dashed, according to the rules for optionality described previously. (Each COURSE OFFERING must be related to one COURSE and to one TEACHER, but that each COURSE and TEACHER may or may not be related to a COURSE OFFERING.)
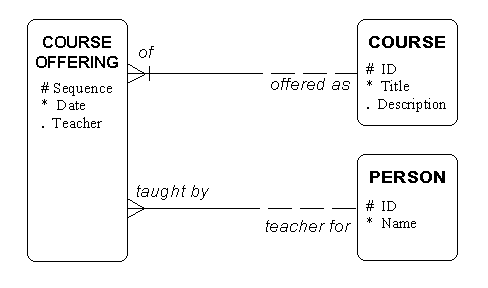
Figure 9: Oracle Unique Identifiers
IDEF1X, on the other hand takes a more dramatic approach. If a relationship participates, the entire line is changed from a dashed line to a solid line, and the entity box so identified is changed from having square corners to having round corners. The identified entity is considered to be conceptually different from those still having the square corners. It is called a "dependent entity". Our example is shown in Figure 10. The relationship between COURSE and COURSE OFFERING is solid because it is part of COURSE OFFERING’s unique identifier, while the relationship between TEACHER and COURSE OFFERING is dashed. The round corners for dependence happen if any of its relationships are identifying.
In addition, IDEF1X describes the unique identifier yet one more time by using the language of relational data base design. Relationships are explicitly (if redundantly) shown as foreign keys, identified by "(fk)". The unique identifier is referred to as a "primary key" and is shown above the line in the entity box. If the relationship participates in a primary key, the foreign key implied by the relationship is shown accordingly.
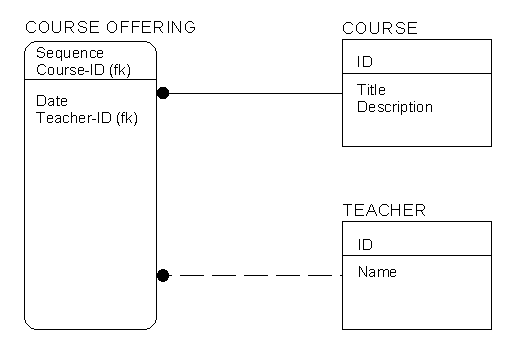
Figure 10: Unique Identifiers in IDEF1X
This places great emphasis on the concept of dependence, but it is questionable whether this is either meaningful to any users viewing the model, or if it in any way changes the response of system designers, who only really need to know what the unique identifier (to be implemented as a primary key) is.
In summary, the following require additional symbols on the model, and it is not clear whether these are either required to make the model more effective in communicating with users, or useful in providing more information to system developers:
- A distinction between an objectified relationship and an intangible entity.
- Multiple inheritance of sub-types.
- Orthogonal sub-types.
- Attributes as alternatives to entities.
- Dependent entities
- Data base design references
By not seeking to add these concepts to the model, you can greatly reduce its complexity and make it more accessible to end users.
Bent Lines
Another way extra symbols get added to a diagram is unintentional: elbows in relationship lines. A corner is a shape, one that draws the eye to it as much as any other shape, but one that carries no semantic meaning. Moreover, when the relationship lines become too convoluted, they also create additional graphic figures on the page -
figures which add clutter, but do not add information. In Figure 11, how many rectangles do you see? How many of them have meaning? The one in the middle is clearly a distraction.
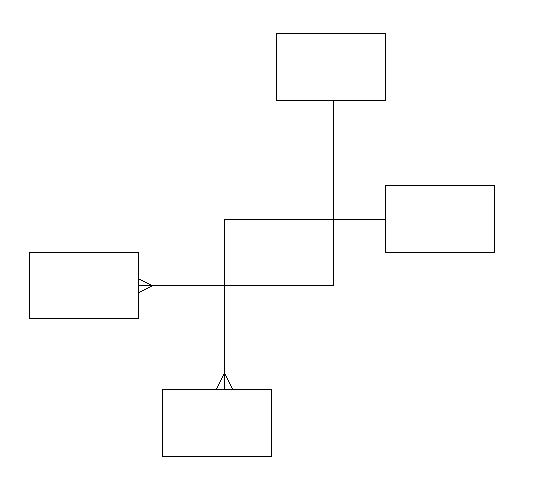
Figure 11: Too many lines
Even if you avoid crossing lines, you do not avoid the problem of ghost shapes. Can you see the fifth rectangle in Figure 12?
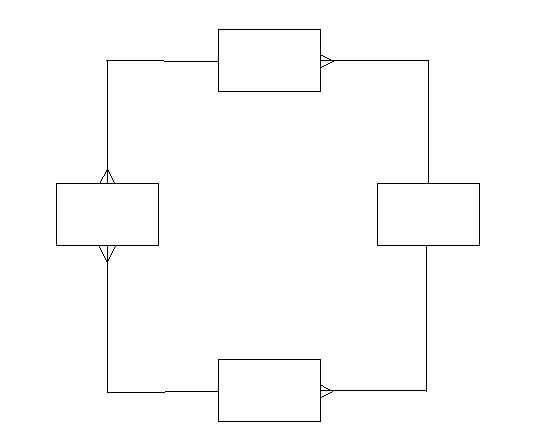
Figure 12: Hidden Square?
The way to avoid bending lines, of course, is to stretch the entities as necessary. (CASE tools which do not allow you to do this are particularly reprehensible.) Figure 13 shows how straighter lines give the entities much greater impact.
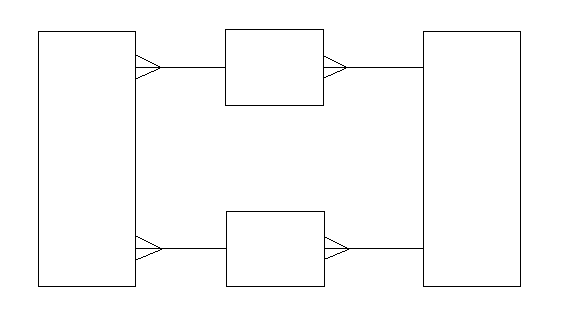
Figure 13: Straighter Lines
Layering
Continuing the remarks quoted above, Edward Tufte goes on to say "Among the most powerful devices for reducing noise and enriching the content of displays is the technique of layering and separation, visually stratifying various aspects of data . . . the various elements of flatland interact creating non-information patterns and texture, simply through their combined presence."[14]
Tufte’s idea of layering is that different kinds of information should be represented in sufficiently different ways that one can view only part of the picture at once, and easily ignore the rest. When attributes are represented as symbols in their own right, as in Mr. Chen’s and the ORM technique, they have the same status on the diagram as entities. Similarly Mr. Chen’s relationship symbols make the viewer see a relationship as another object on the same level as an entity, even though semantically he specifically wants it to be considered as different from an entity. That means that the viewer must deal with entities, relationships, and attributes at the same time, with all competing for attention. The graphic distinctions between completely different kinds of information are small.
There is a natural priority to the concepts we have been discussing here. In working with a user to understand a business, it is most important to know what the entities are and whether the relationships among them are mandatory in either direction. That is, must an occurrence of one entity have an occurrence of another? After that, it is important to ascertain whether an occurrence can have more than one occurrence of the other entity.
Of lesser interest are the specific attributes of each entity.
The lowest priority, and indeed something that probably will not be discussed with the user at all, except in special cases, is whether or not the identity of occurrences of an entity depends on occurrences of another entity. Where this is so, it is usually obvious and not something that requires discussion.
Because of these priorities, graphically, the most dramatic symbols should be the entities and relationships themselves, followed by those used for the cardinality and optionality questions, with perhaps an appended symbol for the unique identifier. In IDEF1X, unfortunately, the most dramatic feature is the least important one -
the notation for unique identifier. This involves the relationship line, the shape of the entity box, and the definition of attributes. Among other things, the use of solid and dashed lines means that the unique identifier decision must be made first, in order to draw the model at all.
This issue of convoluted lines also goes to the point of layering as well. As shown in the example above, the use of many lines with elbows can interfere with the viewer’s ability to pick out the entities. By restricting yourself to straight lines, even if it means stretching the entities, you focus the viewer’s attention on the entities first. In stretching entities, by the way, you have the opportunity to make the most important entities larger, and the lesser entities smaller, further contributing to effective layering.
Poor Naming
The hardest thing for technicians to do is to name things. Many of us got into computers, after all, because we didn’t do all that well in English classes. But names are important. An entity is a thing of significance to the business, about which it wants to hold information. The name of that thing must be meaningful. It cannot be an acronym, or an abbreviation, or a table name. Unfortunately, too many analysts think they are providing table names for a data base management system (with their attendant limitations on length), and the readability of the model suffers.
But we are looking here for the names of things of significance to the business, not tables. In Mr. Chen’s drawing above (Figure 2), the entity names PROJ and SUPP are less than fully explanatory. Even worse, PART-PROJ-SUPP is not at all meaningful. Better would be something like SUPPLY, which at least conveys the idea that something is being supplied. Failure to name entities meaningfully makes it virtually impossible to understand what a data model is about.
Relationship names are even harder. Some techniques, such as SSADM and Yourdon’s object-modeling technique, don’t show relationship names at all. While it is true that this further simplifies the model aesthetically, it deprives the viewer of very important information about the model’s meaning. Where they are used, it has become a convention to use verbs as relationship names, but unfortunately verbs, if not completely meaningless, are often less than expressive of the full implication and meaning of the relationship. "Has" is the most commonly used relationship name, and it tells very little about the true nature of the relationship.
Moreover, when a verb is used, the relationship name often begins to look like a function name -
which is the rightful topic of a different kind of model.
It is preferable to use prepositional phrases, since the preposition, after all, is the part of speech that specifically addresses relationships. Oracle’s Oracle Method has a particularly clever way to do this, using a normal but highly structured sentence to describe an entire relationship. The relationship names are designed to fit into the following structure, reading the relationship in each direction:
Each
<entity 1>
must be
[or]
may be
<relationship>
one and only one
[or]
one or more
<entity 2>
.
The sentence neatly captures not only the relationship itself, but also its cardinality and optionality. For example, in Figure 14, the relationship shown may be expressed by the two sentences:
- "Each ORDER may be composed of one or more LINE ITEMS."
- "Each LINE ITEM must be part of one and only one ORDER."
As described previously, the presence or absence of crow’s feet dictates "one or more" (upper limit many) or "one and only one" (upper limit one). The solid line half means "must be" (lower limit one) and the dashed line half means "may be" (lower limit zero).
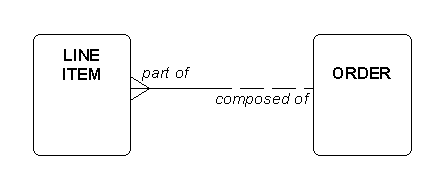
Figure 14: Oracle Relationship Names
Patterns
One way to produce attractive models is to take advantage of the work of others. Your author has published a set of standard models for standard business situations, all of which attempt to follow the principles described here.[15] These models have been presented to business people at all levels, and have been well received.
In addition, if modelers tend to use the same basic models for the same things, they will be able to read each others’ models more easily.
What to do?
So, what is a person to do to make a diagram that is attractive and easy to read?
- Limit what you are trying to present to that which is meaningful and important to your audience. While it is desirable to present as much as possible, this exercise rapidly reaches the point of diminishing returns, where the addition of more information to the drawing actually subtracts from its overall effectiveness. Among other things, this means:
-
Using as consistent and spare a notation scheme as possible.
- Limiting the number of objects appearing on a diagram.
-
Arrange the diagram in a rational way.
- Make sure that your names are meaningful and clear.
- Use patterns that have been tested.
Presenting your model
As important as the construction of a model is, it is equally important to present it in a way that permits the viewer to ease his way into the concepts involved. Models can be presented in an understandable way if a few rules are followed.
First of all, be sure to begin the session with a careful and thorough explanation of just what it is you are trying to do. You cannot build a system without their assuring you that you understand their business. This technique is intended to show them what you understand, so you can correct it if necessary. You are there to be wrong, since it is much cheaper for you to be wrong now, than it is to wait and be wrong in the design of a system. Your presentation is in terms of the structure of their data, so by extension, it is really about the structure of their business. Admit that the technique is a bit arcane and point out that it examines business from a perspective which may be unfamiliar to them, so ask their indulgence.
Then, do not begin by presenting a completed model. Even the most artistic model is too frightening to see as a whole. Begin by presenting a slide with one entity. Discuss that entity. What does it mean? What are its attributes? Can you think of any examples?
Add another one, with a relationship between the two. Discuss the second entity. Then discuss the relationship. Is it true that it must be related to only one? Can you ever imagine a case where it is related to more than one? You can then add a couple of more entities and relationships at a time, discussing each part thoroughly, until you have completed the page. Then build up the next drawing in the same way.
Where you have intersect entities, always present the reference entities first. You may even have a slide showing a many to many relationship. Discuss the need for attributes that apply to each occurrence of a pair. Then present the slide with the intersect entity.
In doing the presentation, be sure to have a marking pen handy. You will be amazed at how quickly the audience becomes so involved that it tells you where you are wrong. Listen. Where you are wrong (and you will be wrong), mark up the slide to demonstrate that you are listening.
True life stories
I have been presenting models to executives for over ten years now. In all this time, there have been exactly two "feedback sessions from hell", where the audience had no patience for the pictures and all but threw me out -
largely because in each case I failed at the beginning of the session to get them to understand what we were trying to accomplish.
For the most part, however, my audiences have been very enthusiastic. Not only did they understand the models, but they appreciated the fact that the models displayed subtlety in understanding of what their business was about. In many cases, no systems person had ever come to them with that subtlety of understanding before.
I have presented to the executive committees of a news gathering organization, two major pharmaceutical research departments, an oil refinery, and an automobile parts company, to name a few. In each case, I was complimented afterwards on how thoroughly I seemed to understand their business. You would have thought I had been in the business for years, instead of a couple of months.
Interestingly enough, I have gotten the most resistance from Information Technology departments. As a consultant I was often brought in to speak directly with the user community, bypassing the IT Department. When it was clear that I connected with that community, the IT people were sometimes not pleased. More significantly, the language of data modeling was often better received by business executives - who, after all, know the business being modeled - than by IT technicians who are not accustomed to thinking this abstractly about the things in the business.
Properly drawn and properly presented, entity/relationship models can be very effective in communicating with the business community. I know. I’ve done it.
Footnotes
- Edward R. Tufte, Envisioning Information. (Cheshire, Connecticut: Graphics Press, 1990), p.53.
[Return]
- Peter Chen, The Entity-Relationship Approach to Logical Data Base Design. Wellesley, MA:QED Information Sciences,1977.
[Return]
- James Martin, Recommended Diagramming Standards for Analysts and Programmers. Englewood Cliffs, NJ:Prentice-Hall, Inc., 1987, pp 213-239.
[Return]
- Thomas A. Bruce, Designing Quality Databases: Practical Information Management & IDEF1X, New York:Dorset House Publishing, 1992.
[Return]
- Richard Barker, CASE*MethodÔ Entity Relationship Modelling. Wokingham, England:Addison-Wesley Publishing Company, 1990.
[Return]
- Ed Downs, Peter Clare, and Ian Coe, Structured Systems Analsysis and Design Method. Englewood Cliffs, NJ:Prentice-Hall, Inc., 1988).
[Return]
- James Martin and James J. Odell, Object-oriented Methods. Englewood Cliffs, NJ:PTR Prentice-Hall, Inc., 1995.
[Return]
- James Rumbaugh, Michael Blaha, William Premerlani, Frederick Eddy, and William Lorensen, Object-oriented Modeling and Design. Englewood Cliffs, NJ:Prentice-Hall, Inc., 1991.
[Return]
- Sally Shlaer and Stephen J. Mellor, Object-oriented Systems Analysis: Modeling the World in Data. Englewood Cliffs, NJ:Prentice-Hall, Inc., 1988.
[Return]
- David W. Embley, Barry D. Kurtz, and Scott N. Woodfield, Object-oriented Systems Analysis: A Model Driven Approach. Englewood Cliffs, NJ:Yourdon Press, 1992.
[Return]
- Edward Yourdon and Peter Coad, Object-oriented Analysis. Englewood Cliffs, NJ:Prentice-Hall, Inc., 1990.
[Return]
- Terry Halpin, Conceptual Schema & Relational Database Design. Sydney:Prentice-Hall Australia, 1995.
[Return]
- This example is from Chen, op cit, pp. 17-20
[Return]
- Tufte, op. cit.
[Return]
- David C. Hay, Data Model Patterns: Conventions of Thought. New York:Dorset House Publishers, Inc, 1996.
[Return]